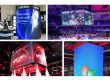


LED display power consumption becomes a useful running-cost estimate only when you combine the screen’s operating power with its actual schedule. Multiply active display area by representative watts per square meter, convert the result to kilowatts, and calculate energy use for each operating period. Include equipment outside the screen’s power rating before applying the electricity tariff.
For an AV integrator preparing a proposal, the difficult part is choosing defensible inputs. A supplier’s maximum rating, an unspecified “average,” and a meter reading from a dark demonstration video describe different conditions. Treating them as interchangeable can distort the budget presented to the client.
This guide turns LED display power consumption into a procurement worksheet: define what the figures include, separate daytime and evening operation, and request evidence that can be checked at commissioning. The worked example uses clearly labeled assumptions, so you can replace every input with project-specific data.
1. How Much Power Does an LED Display Use?
There is no single wattage that accurately represents every direct-view LED wall. Total demand depends on display area, hardware configuration, brightness, content, and operating state. A useful answer to “How much electricity will this screen use?” therefore needs both a power figure and a time period.
Start by defining the measurement boundary. Does the quoted LED display power consumption cover complete cabinets at their AC inputs, LED modules alone, or the entire installation? Processors, media players, network equipment, external ventilation, and enclosure cooling may sit outside a cabinet specification.
| Quantity | What it tells you | Correct budgeting use |
|---|---|---|
| W or kW | Real electrical power at a given operating condition | Convert to energy using operating time |
| W/m² | Power normalized by display area | Multiply by the area covered by that rating |
| Wh or kWh | Energy consumed over an interval | Apply the applicable energy tariff |
| W per cabinet | Power for one specified cabinet | Multiply by cabinet count; separate different cabinet types |
| cd/m², or nits | Screen luminance | Record as a comparison condition, not an electricity unit |
A kilowatt-hour means one kilowatt used for one hour. Avoid “kilowatts per hour” when describing electricity consumption. Also distinguish installed capacity from consumption: a power supply’s rated output describes its capacity, not the continuous draw of the connected modules.
For proposals, label LED display power consumption figures as supplier-rated, assumed, or measured. That small distinction tells the buyer how much confidence to place in the forecast and which inputs still need verification.
2. Maximum vs. Average Power Consumption: What’s the Difference?
Maximum and average LED display power consumption answer different procurement questions. Maximum ratings inform electrical planning; representative operating averages help estimate energy costs. Neither becomes reliable merely because it appears in a specification table.
01. Read the maximum rating with its test conditions
Ask how the manufacturer establishes maximum input power. Relevant conditions include the displayed test pattern, brightness limit, calibration, input voltage, and enabled cabinet accessories. Full-white content is commonly used to exercise a high load, but the documented test procedure should define the rating.
An electrical designer also needs input current, startup behavior, power factor, circuit arrangement, and applicable installation requirements. Multiplying W/m² by area does not, by itself, select a breaker, cable, connector, or generator.
02. Find out what “average” actually means
An average calculated during one playlist may not represent a different advertising schedule. Request the averaging duration, content sequence, luminance, and included loads. Do not convert maximum LED display power consumption into an average using an unexplained fixed percentage.
For budgeting, retain separate operating profiles instead of compressing everything into one number too early. A lobby wall showing presentations, idle signage, and occasional bright event graphics needs a schedule that reflects those uses. If evidence is incomplete, present clearly labeled scenarios and identify the measurement that will resolve the uncertainty.
Keep supplier documentation with the quotation revision. A change in module, power supply, or cabinet configuration can make an earlier LED display power consumption estimate unsuitable for the final bill of materials.
3. What Affects LED Display Power Consumption?
01. Luminance and image content
Higher light output generally requires more electrical input from the same display under comparable conditions. However, a controller’s brightness percentage is not a calibrated power scale. A change from one setting to another does not establish a matching percentage reduction in electricity use.
Content also changes LED display power consumption because direct-view LEDs emit light according to the image. Large bright backgrounds and darker compositions create different loads. Average picture level helps describe content, but it cannot replace measurement: color balance, processing, and drive behavior also influence demand.
02. Display architecture and power conversion
Pixel pitch affects pixel density, yet pitch alone cannot rank energy efficiency. LED packages, drive current, scanning configuration, driver circuitry, and calibration all matter. Compare complete displays at the required visual performance rather than assuming that the finest pitch must consume the most power.
Power supplies convert AC input into DC for the electronics. Their efficiency affects LED display power consumption at the mains. If the supplier already reports complete-cabinet AC input, conversion losses are already included; adding another blanket “power-supply loss” allowance would count them twice.
03. Temperature and supporting equipment
Fans and other thermal equipment introduce additional loads. External cooling can vary with weather, enclosure design, and duty cycle. Keep these loads identifiable so the budget can respond to site conditions without changing the screen’s own test results.
For example, EagerLED’s EA1000F2 product documentation describes aluminum module baseplates, cabinet fans, and a power-supply heat-transfer path. These are features to investigate during thermal planning, not proof of a particular energy-saving percentage.

4. Indoor vs. Outdoor LED Screens: Comparing Power Requirements
Outdoor installations often need more light output to remain readable in daylight. Indoor installations can face substantial daylight too, particularly behind shop windows or beneath glazed roofs. The location label alone is insufficient for forecasting LED display power consumption.
An indoor-versus-outdoor LED display power consumption comparison should begin with actual viewing conditions. Then specify suitable luminance, daily hours, and thermal requirements for each proposal. A shaded outdoor wall and a sunlit retail window should not inherit a generic budget simply because one is outside and the other is inside.
| Project condition | Potential budget effect | Information to obtain |
|---|---|---|
| Controlled indoor lighting | Allows a defined operating luminance | Room lighting scenes and presentation requirements |
| Indoor glazing or skylights | May require different daytime settings | Sun exposure and seasonal light conditions |
| Outdoor daylight operation | Creates a distinct daytime load profile | Screen orientation and daytime luminance target |
| Outdoor evening operation | May permit lower output than daytime | Approved evening settings and operating hours |
| Enclosed installation | May add ventilation or cooling energy | Thermal design and auxiliary equipment schedule |
Use EagerLED’s indoor display range to identify candidate configurations, then request operating data for the selected model. Category pages help establish options; a project budget needs the exact configuration.
Check service access as well. A front-service design changes how technicians reach components, but it does not establish cooling clearance. Preserving the specified thermal path helps keep LED display power consumption measurements representative of the installed system.
5. How to Calculate LED Screen Power from Area and W/m²
The basic LED display power consumption formula is:
Screen power (kW) = Display area (m²) × Power density (W/m²) ÷ 1,000
For a rectangular screen, area equals width multiplied by height. Use meters for both dimensions. If a drawing is in feet, convert dimensions before calculating, or multiply square feet by 0.092903 to obtain square meters.
For example, an assumed 4 m × 2.5 m display—approximately 13.1 ft × 8.2 ft—has an area of 10 m², or about 107.6 ft². At an assumed operating density of 250 W/m², its screen load is 2.5 kW. These are calculation inputs, not specifications for an EagerLED model.
For irregular layouts, add the actual emitting surfaces. For a double-sided installation, include both faces. For mixed cabinets, calculate each cabinet group separately if its power density or operating profile differs.
Then add only equipment excluded from that boundary:
System power (kW) = Screen input power + Excluded auxiliary power
A second method checks the LED display power consumption calculation against the cabinet schedule: multiply each cabinet type’s input watts by its quantity and add the results. The area method and cabinet method should agree when they use the same configurations and conditions.
Investigate any mismatch before pricing the electrical work. Common causes include confusing module watts with cabinet watts, overlooking a second screen face, or using gross architectural dimensions that include non-display borders.
6. How to Estimate Monthly Electricity Costs: A Worked Example
Build the energy budget from operating periods. This captures changes in LED display power consumption that a single daily average can conceal.
Period energy (kWh) = Average period power (kW) × Period hours
Monthly energy = Sum of daily period energy × Operating days
The following hypothetical project uses a 10 m² screen, six daytime hours, six evening hours, and twelve hours in standby. Every power value below is an assumption. The daytime and evening screen figures include internal cabinet electronics and fans; the separate auxiliary line covers only external equipment.
| Daily operating item | Assumed input | Average power | Hours/day | Energy/day |
|---|---|---|---|---|
| Daytime screen operation | 10 m² × 250 W/m² | 2.50 kW | 6 | 15.00 kWh |
| Evening screen operation | 10 m² × 120 W/m² | 1.20 kW | 6 | 7.20 kWh |
| External processing and network equipment | Separate active-period load | 0.10 kW | 12 | 1.20 kWh |
| Complete system in standby | Combined off-hours load | 0.08 kW | 12 | 0.96 kWh |
| Total | Screen plus excluded equipment | Varies by period | Full daily schedule | 24.36 kWh |
The standby row includes all equipment that remains energized during those twelve hours. The external-equipment row applies only during active operation, so the two rows do not overlap. This example assumes no separate external cooling load.
At 30 operating days, monthly energy is 24.36 × 30 = 730.8 kWh. Using a hypothetical flat energy rate of USD 0.18/kWh, the energy charge is USD 131.54 per month, rounded to cents. The rate is an arithmetic assumption, not a quoted electricity price.
01. Add the tariff details that affect the actual bill
If the tariff changes by time of day, calculate each period’s cost separately. Some commercial tariffs also include demand charges, fixed charges, or other items. LED display power consumption alone cannot determine those charges without the tariff rules and the facility’s load profile.
In particular, a display’s maximum nameplate kW does not automatically equal its incremental billed demand. The relevant question is how its load coincides with the billing interval and the rest of the site.
02. Show which assumptions matter most
For this assumed 10 m² screen running twelve hours daily, a 10 W/m² change across all active hours changes monthly energy by 36 kWh over thirty days. At the example rate, that equals USD 6.48. This sensitivity calculation helps prioritize better evidence for LED display power consumption instead of presenting false precision.
7. How to Measure Actual LED Display Energy Use
Measure real energy at a defined electrical boundary over representative operation. A brief wattage snapshot can diagnose a condition, but an accumulated kWh reading is more useful for validating LED display power consumption across a complete schedule.
Have qualified personnel select and install instrumentation suitable for the supply, load, and distribution arrangement. Use real-power and energy measurements. Multiplying voltage by current alone gives apparent power in a simple single-phase calculation; it does not establish real watts for a load with a non-unity power factor.
| Record in the test log | Why it matters |
|---|---|
| Meter location and included circuits | Shows whether processing, cooling, and standby equipment are counted |
| Cabinet and module configuration | Connects results to the delivered hardware |
| Playlist and playback timing | Allows the content load to be reproduced |
| Measured luminance and control settings | Prevents a dimmer test from appearing more efficient |
| Start/end time and accumulated kWh | Supports a time-weighted operating average |
| Ambient conditions and cooling state | Explains differences associated with the installation environment |
| Instrument identity and measurement uncertainty | Helps assess whether a claimed difference is meaningful |
Include active operation, transitions, and the actual overnight state. Allow the equipment to reach the agreed operating condition before comparison tests. Extend monitoring to additional days or seasons when one sample cannot represent the intended use.
To summarize LED display power consumption as average system power, divide measured kWh by elapsed hours. Keep the same boundary when comparing that result with the estimate. If commissioning results exceed the budget, check brightness, scheduling, playlist, and unexpected auxiliary loads before attributing the difference to the panels.
8. How to Reduce Power Consumption Without Sacrificing Visibility
Start with the operating requirement: readable content at the intended viewing positions, throughout the approved schedule. Reducing LED display power consumption has value only if the installation still performs its job.
01. Establish usable brightness profiles
Commission daytime and evening settings at the site. Where automatic adjustment is used, check sensor placement, response behavior, and fallback settings. A sensor exposed to conditions unlike the screen face can drive inappropriate output.
Verify the finished image at each setting. Low-brightness operation should preserve required detail, grayscale, and camera performance where filming is part of the application. Do not reduce drive settings solely to produce an attractive wattage reading.
02. Eliminate unnecessary operating hours
Coordinate display schedules with building access, advertising commitments, and event calendars. A black image may leave electronics powered. Follow the equipment’s approved shutdown sequence and retain any monitoring or environmental functions the installation requires.
Review the schedule after handover. Temporary commissioning settings can remain active unintentionally; an extra overnight operating period can outweigh a modest improvement in LED display power consumption during normal hours.
03. Evaluate content and cooling together
Test alternative layouts when brand and accessibility requirements allow. A readable composition with less large-area brightness may use less energy, but approve the design with the content owner. Preserve ventilation paths and follow maintenance instructions rather than disabling necessary cooling.
Record the before-and-after kWh, visual settings, and schedule. That produces a defensible LED display power consumption improvement with a clear explanation of where the saving came from.
9. How to Compare Supplier Power Ratings and Energy-Saving Claims
A credible LED display power consumption comparison holds the required service constant: display area, luminance, content, operating hours, and acceptable image quality. Hardware features become useful evidence only when they translate into measured performance under those conditions.
| Supplier statement | Evidence to request | Procurement response |
|---|---|---|
| “Low average power” | Playlist, luminance, duration, and AC measurement boundary | Recalculate against your schedule |
| “Energy-saving drive architecture” | Complete-display comparison at equivalent output | Assess the result beyond the component label |
| “Lower watts per cabinet” | Cabinet dimensions and configuration | Normalize to equal display area |
| “Lower lifetime cost” | Price difference, energy assumptions, service scope, and evaluation period | Separate measured savings from forecasts |
| “Guaranteed consumption” | Defined acceptance conditions and contractual scope | Agree on a reproducible verification procedure |
Evaluate LED display power consumption before converting the difference into money. First establish the annual kWh difference under a common schedule. Then apply the relevant tariff and compare any additional investment.
Simple energy-only payback = Additional investment ÷ Annual energy-cost saving
Use this expression only when the denominator is positive and the assumptions are explicit. It excludes financing and other ownership costs. If maintenance, cooling, or downtime differences are included in a broader model, document them separately and avoid counting the same benefit twice.
Attach an acceptance schedule to the purchase specification. Define the configuration, test content, luminance, environmental conditions, measurement boundary, and method for resolving discrepancies. This makes LED display power consumption a checkable project requirement rather than an unsupported sales comparison.
10. FAQ
01. Does using 230 V instead of 120 V halve LED display power consumption?
No. For equipment approved for both supplies, higher voltage can reduce the current required for similar real power, but it does not automatically halve kWh. Power-supply efficiency may differ with input voltage and load. Compare measured AC input under equivalent operating conditions.
02. Can I size a UPS from the average screen wattage?
Average wattage alone is insufficient. UPS selection also needs supported watts and VA, startup behavior, runtime, battery conditions, and the loads that must remain operational. Decide whether backup covers the full wall, only the control system, or an orderly shutdown, then obtain a suitable engineered design.
03. Can solar panels supply an LED billboard?
Potentially, but annual solar generation alone does not establish feasibility. Match generation and storage to the display’s hourly demand, location, seasonal conditions, and required availability. A specialist should evaluate the complete system, including any grid connection, storage losses, and backup arrangements.
04. Does a higher refresh rate always mean a higher electricity bill?
No universal percentage relationship applies to LED display power consumption. Refresh behavior interacts with driver design, scanning, grayscale, and other settings. Compare candidate configurations at the refresh rate and visual quality the application requires, rather than estimating energy from the refresh-rate number alone.
05. Will replacing modules change LED display power consumption?
It can if replacement parts differ in their electrical or optical characteristics, or require different calibration. Use approved compatible parts and preserve the configuration record. After substantial replacement work, repeat representative measurements before relying on the original operating-cost forecast.
06. Can I convert screen kWh directly into generator fuel cost?
No. Fuel use depends on generator efficiency at the actual combined load, operating hours, and other equipment it supplies. Use the generator manufacturer’s relevant fuel-consumption data and the expected load profile. A utility electricity rate is not a substitute for that calculation.
07. Can energy data be used to report a display’s carbon emissions?
Measured kWh can support an operational electricity-emissions estimate when paired with an appropriate emissions factor and reporting method. State the geography, period, and accounting boundary. This does not establish the display’s full life-cycle footprint, which also involves manufacturing, transport, and end-of-life assumptions.
08. How should an integrator allocate electricity costs between tenants?
Use agreed metering boundaries and a documented allocation method for shared equipment. Screen area alone may be unfair when operating hours and brightness differ. Check the property’s billing arrangements and applicable local requirements before treating a monitoring estimate as a billable energy measurement.
11. Conclusion
A useful LED display power consumption budget gives the buyer a traceable route from specification to monthly energy cost. Define the electrical boundary, calculate each operating period, identify assumptions, and verify the delivered system against the same conditions.
Before requesting a quotation, prepare the display dimensions, location, daytime and evening schedule, content type, luminance requirements, and auxiliary-equipment scope. Send those project details to EagerLED and request configuration-specific power data with its test conditions. You can then compare proposals on a consistent basis and update the running-cost forecast with commissioning measurements.